Grafana Kiosk on the Tinker Board R2.0

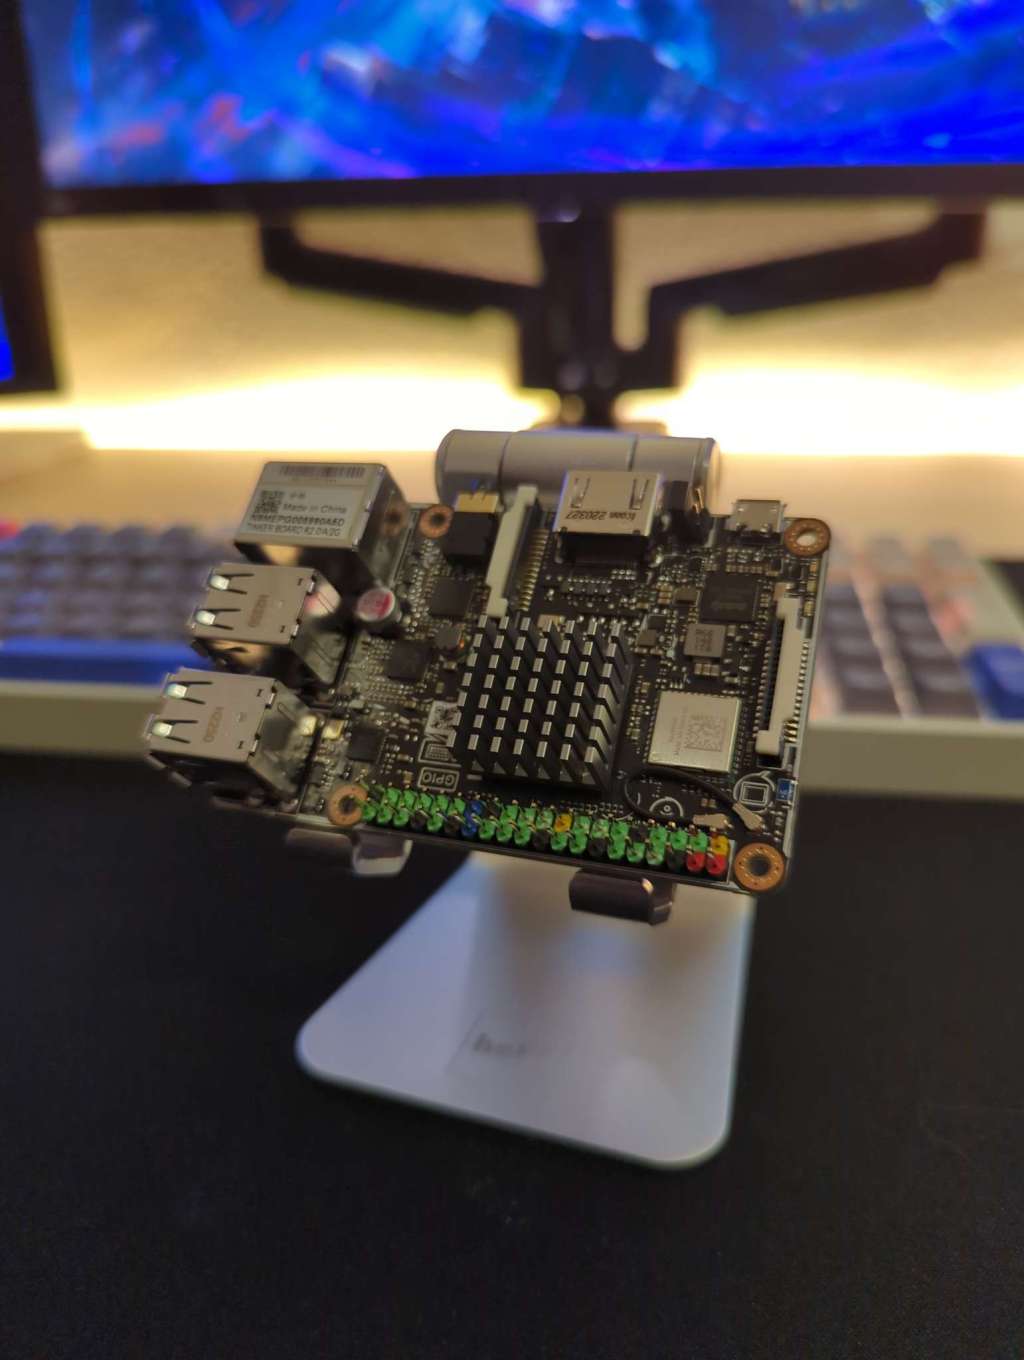
I use Grafana Dashboards to monitor all of my services, but my old Raspberry Pi 3B wasn't up to the task. The frequent crashes were becoming increasingly problematic, so I decided to upgrade to a more powerful board. Unfortunately, the new Raspberry Pi models are hard to come by at a reasonable price. As an alternative, I chose the Tinker Board R2.0, and in this post I'll be sharing my experience of setting it up as a Grafana Monitoring Kiosk.
Getting Tinker Board Images
I obtained the most up-to-date "Tinker Board R2.0 Debian" image from the ASUS Tinker Board Downloads Page for my board. Debian was the most suitable OS for my requirements. In addition, ASUS also offers some Android images that are compatible with this board. Finally, I used Etcher to flash the image onto the SD card I will use.
Initial Configuration
After inserting the SD card into the board and connecting all necessary cables, such as the Ethernet and power, I powered the device up. My DHCP server had automatically assigned the board a new IP address, thus allowing me to securely connect to it via SSH using the default credentials.
Default credentials:
User: linaro
Password: linaro
It is highly recommended that you change the default credentials. So I changed it via this command:
passwdEnable Desktop GUI
By default, the Desktop GUI is not enabled. To activate it, I accessed the configuration utility by entering the following command:
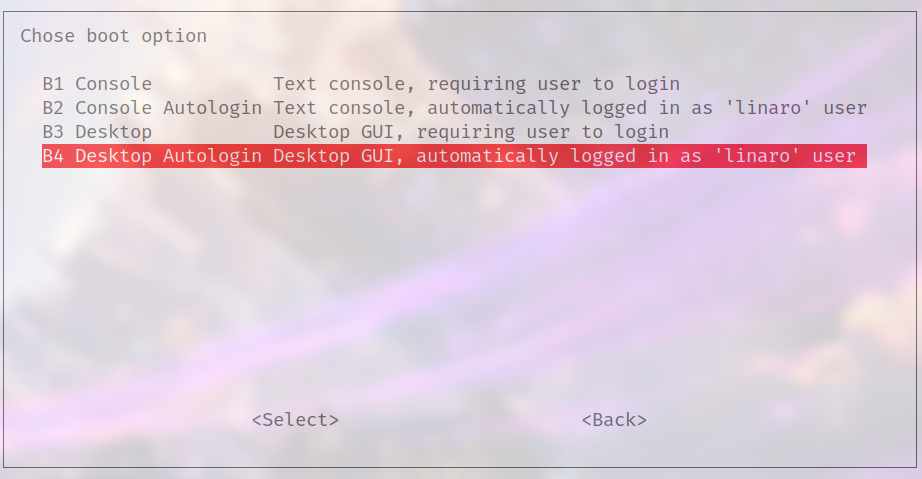
sudo tinker-configI navigated to the "Boot Options" menu and changed the "B1" entry to "B4 Desktop Autologin".

After a reboot I was greeted with the Desktop Interface.
Installing and configuring the VNC server
I want to remotely control my device via VNC, eliminating the need to keep a keyboard and mouse connected. To do this, I needed to set up a VNC server. I personally use "x0vncserver" for all of my devices (see this post), so I'll installed the necessary package.
sudo apt install tigervnc-scraping-serverNow I set a password for the VNC server via the command:
vncpasswdAt last, I successfully created and enabled a systemd service for the VNC server. To ensure the x11 display was already running when the service attempted to start the VNC server, I added a 30 second delay.
[Unit]
Description=x0vncserver

[Service]
User=linaro
Group=linaro
ExecStartPre=/bin/sleep 30
ExecStart=/usr/bin/x0vncserver -display :0 -passwordfile /home/linaro/.vnc.passwd
Restart=always

[Install]
WantedBy=multi-user.target
Enable service:
sudo systemctl enable x0vncserver.serviceSetting up the Grafana Kiosk Application
Finally I can setup the Grafana Kiosk. For this I downloaded the ".armv7" binary from the Grafana Kiosk GitHub page and followed the instructions provided.
After I ensured myself that the Kiosk was working as expected, I also created a systemd entry for the application.
[Unit]
Description=Grafana Kiosk
Documentation=https://github.com/grafana/grafana-kiosk
Documentation=https://grafana.com/blog/2019/05/02/grafana-tutorial-how-to-create-kiosks-to-display-dashboards-on-a-tv
After=network.target

[Service]
User=linaro

Environment="DISPLAY=:0"
Environment="XAUTHORITY=/home/linaro/.Xauthority"

# Disable screensaver and monitor standby
ExecStartPre=xset s off
ExecStartPre=xset -dpms
ExecStartPre=xset s noblank

ExecStart=/usr/bin/grafana-kiosk -URL=http://192.168.1.152:3000/d/OEyH9tQZk/ -login-method=local -username=admin -password=password -kiosk-mode=full -ignore-certificate-errors -playlists -ignore-certificate-errors

[Install]
WantedBy=graphical.target
Unfortunately, I encountered an issue when I enabled this service at boot (also with a 30 sec delay). The Kiosk application would be able to log in to the grafana "server" but would shortly afterward get an unauthorized error. A relaunch fixes this issues tho and everything works as expected. If you know a fix for this issue, let me know in the comments.
I hope this post was able to give you some insight how also you could set up your own Monitoring Kiosk.
